Where is that documentation? A tale on setting up diagnostic settings...
I’m a big fan of Azure and building infrastructure on it using IaC (Infrastructure as Code) and deploy it through pipelines (Azure DevOps) or workflows (Github). The last two years, I primarily used Bicep to build the infrastructure. This is often a very satisfying experience but in some cases it can be quite frustrating. Frustrating because I can’t find the information that I need in the MS Learn documentation at the location where I would expect it to be.
The use case
The client I’m working for, is operating in a highly regulated environment. Reputation, confidentiality, trust and responsibility are key. This means that everything that happens in their business needs to be verifiable. A consequence is that every year the client is undergoing an external audit. As a result the IT environment and infrastructure that they are using, hence Azure, has to be compliant.
The Center for Internet Security (CIS) benchmarks are a set of compliance best practices for a range of IT systems and products. These benchmarks provide the baseline configurations to ensure both CIS compliance and compliance with industry-agreed cybersecurity standards.
Therefor Azure Defender was set up to do the CIS compliancy checks. After running the checks, it turned out that we had a lot of work to do in order to become CIS compliant. One of the finding was that we needed to turn on diagnostic logging for every Azure resource possible. My job was to remediate the logging part.
Diagnostic settings option in the Azure Portal
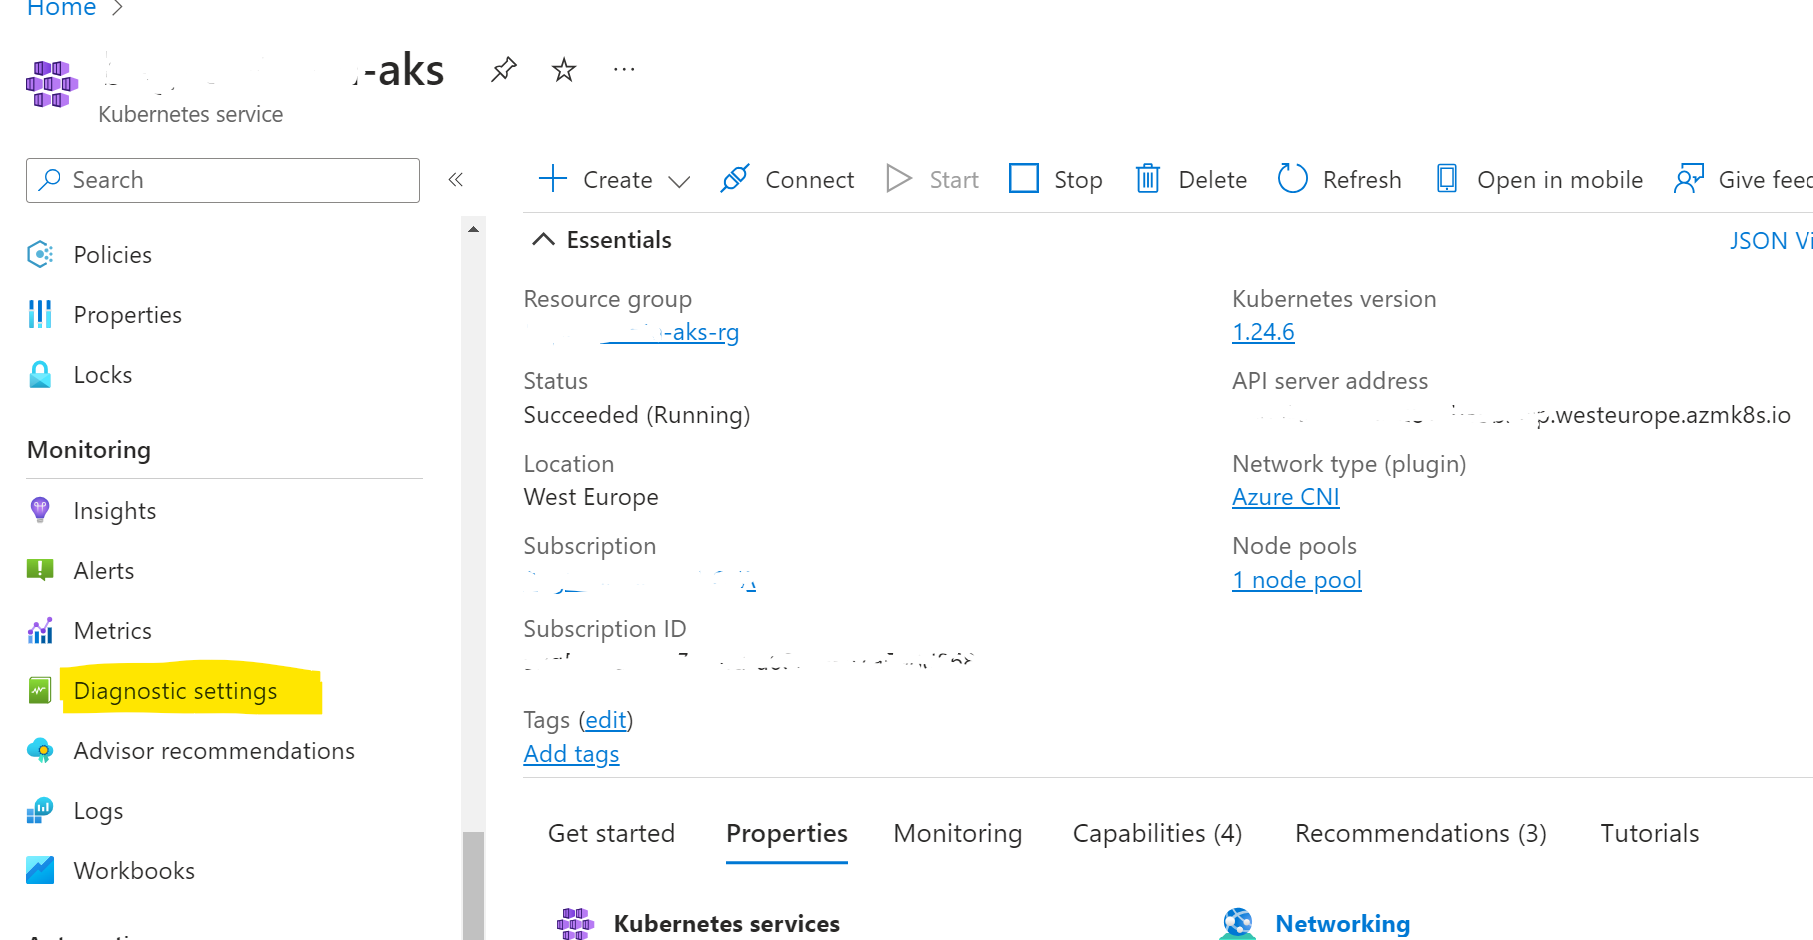
I started to investigate what kind of logging I could turn on by clicking through the Azure Portal. Many of the resources in Azure have Diagnostic Settings. As an example a screenshot of an AKS resource. Under the Monitoring section of the left hand menu, Diagnostic settings are available.
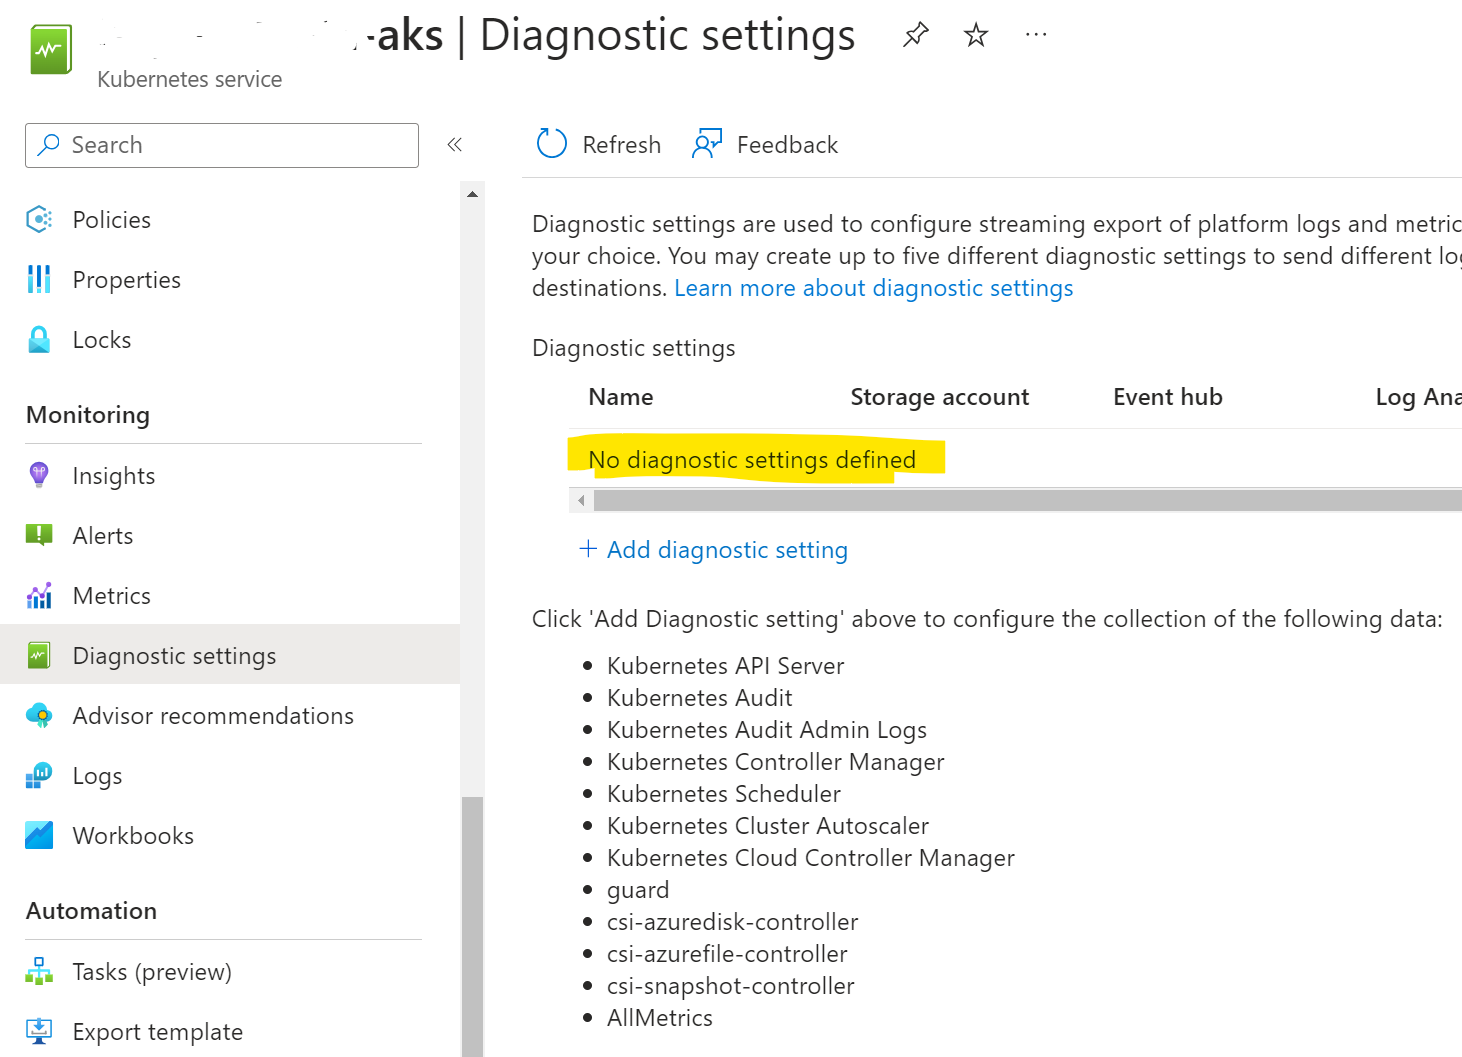
After opening the the Diagnostic logging blade, I could see that there was nothing configured.
MS Learn documentation
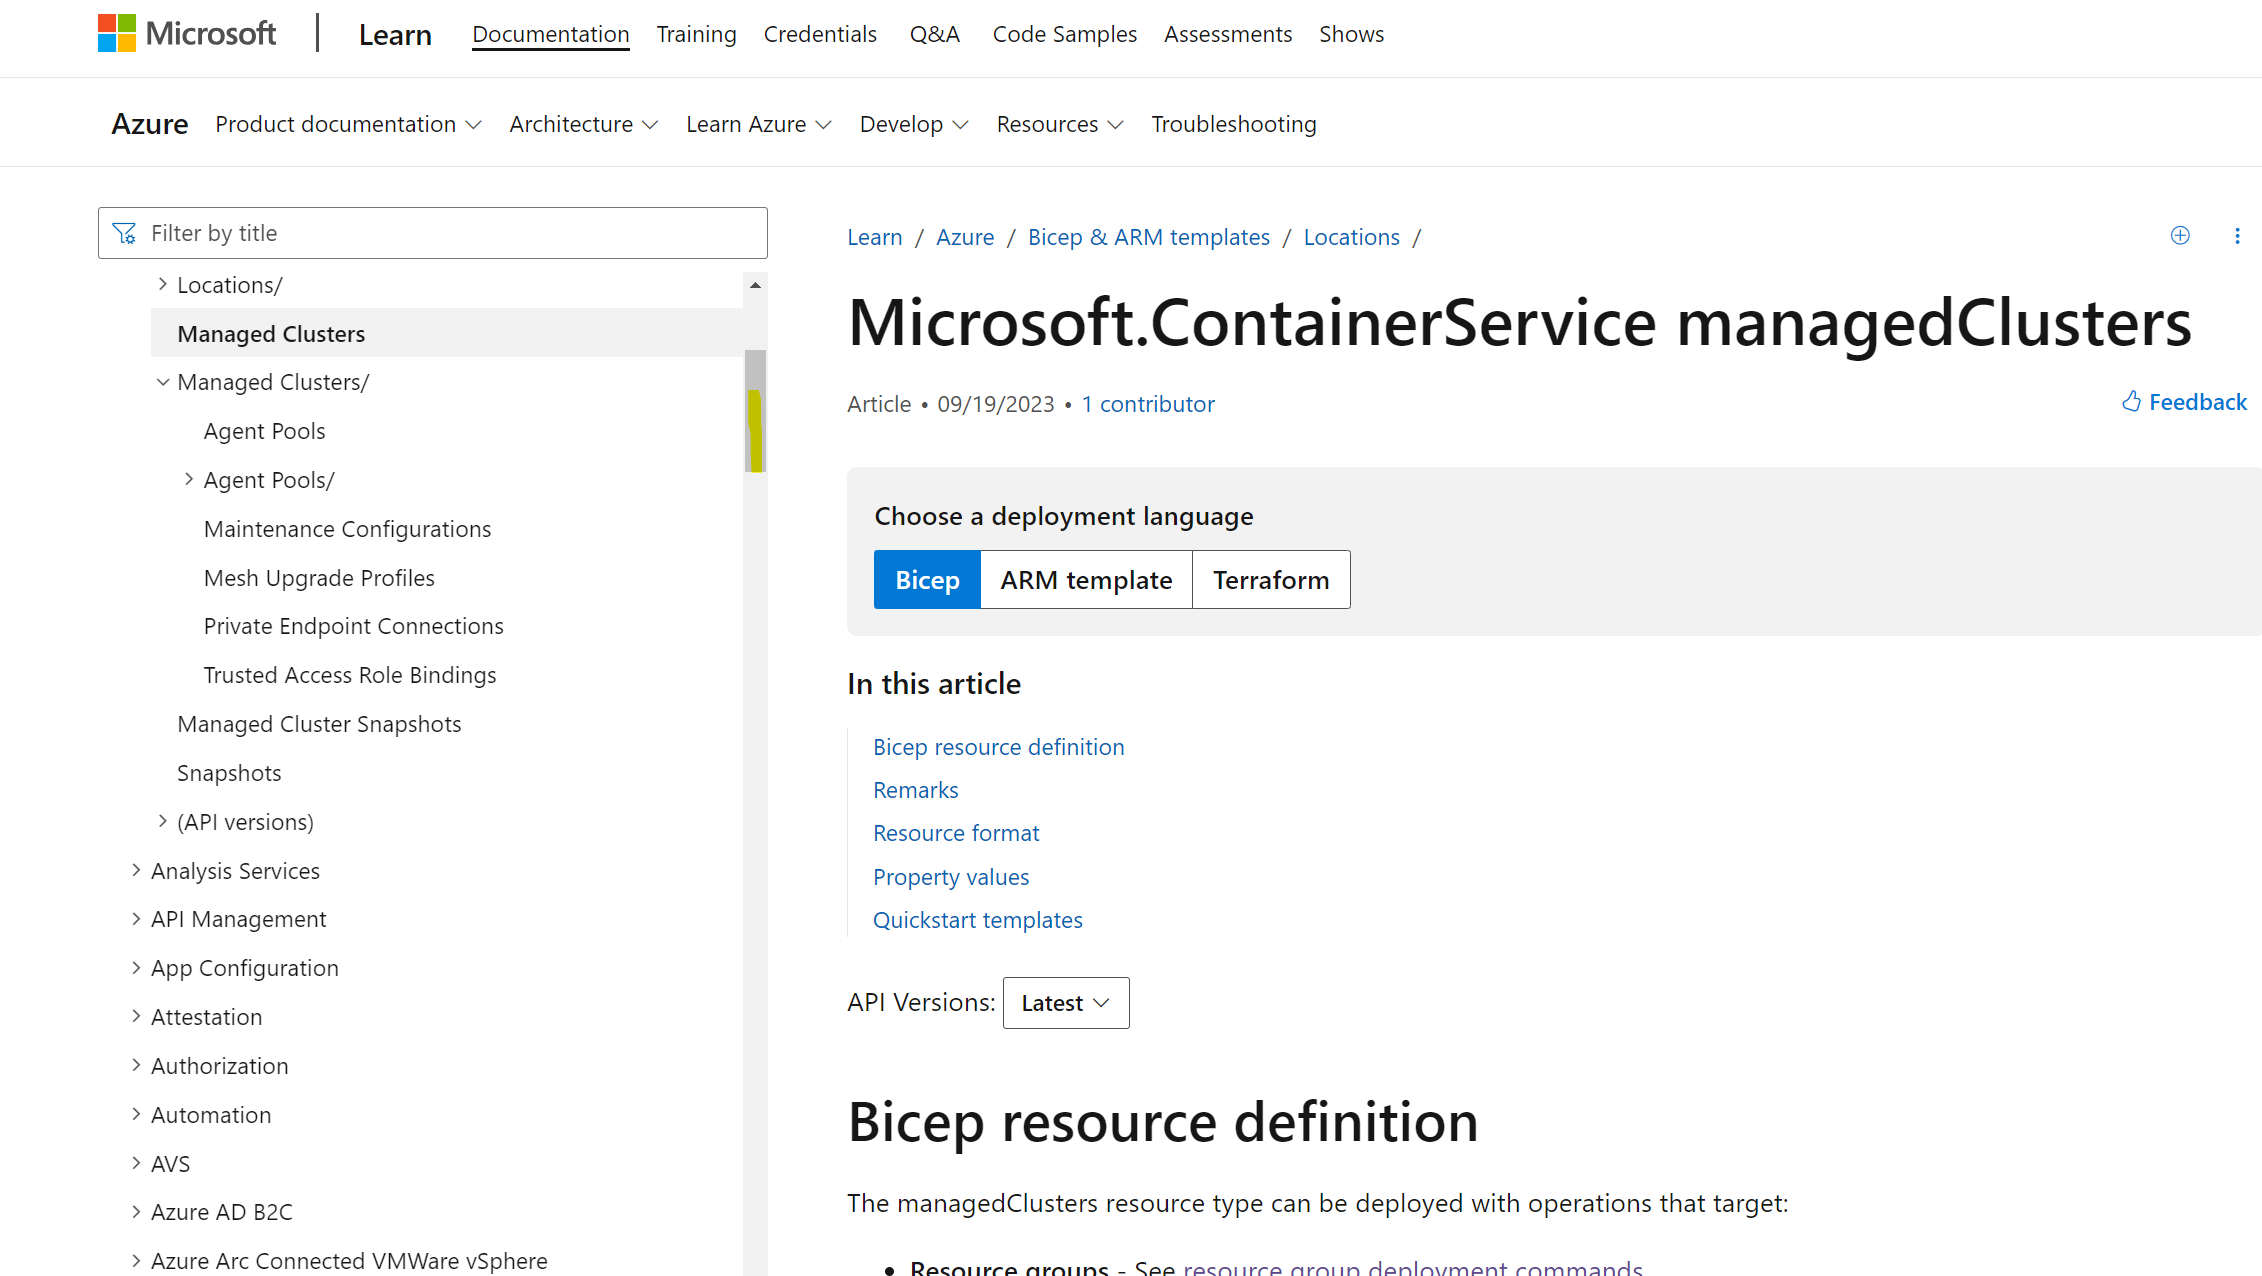
As we already had setup the resource (AKS cluster) in Bicep, I looked for the resource type in the Bicep file and started to search for documentation. In this case I searched for bicep + Microsoft.ContainerService/managedClusters and I found the documentation page on MS Learn. Soon I realized that I could not find anything about Diagnostic settings in this section of the documention. Not even an example or a reference link to the Microsoft.Insights/diagnosticSettings resource. “Strange?!” was my initial thought.
Back to the Azure Portal
I reopened the Azure Portal and decided to setup the Diagnostic settings by hand, by clicking it in the Portal.
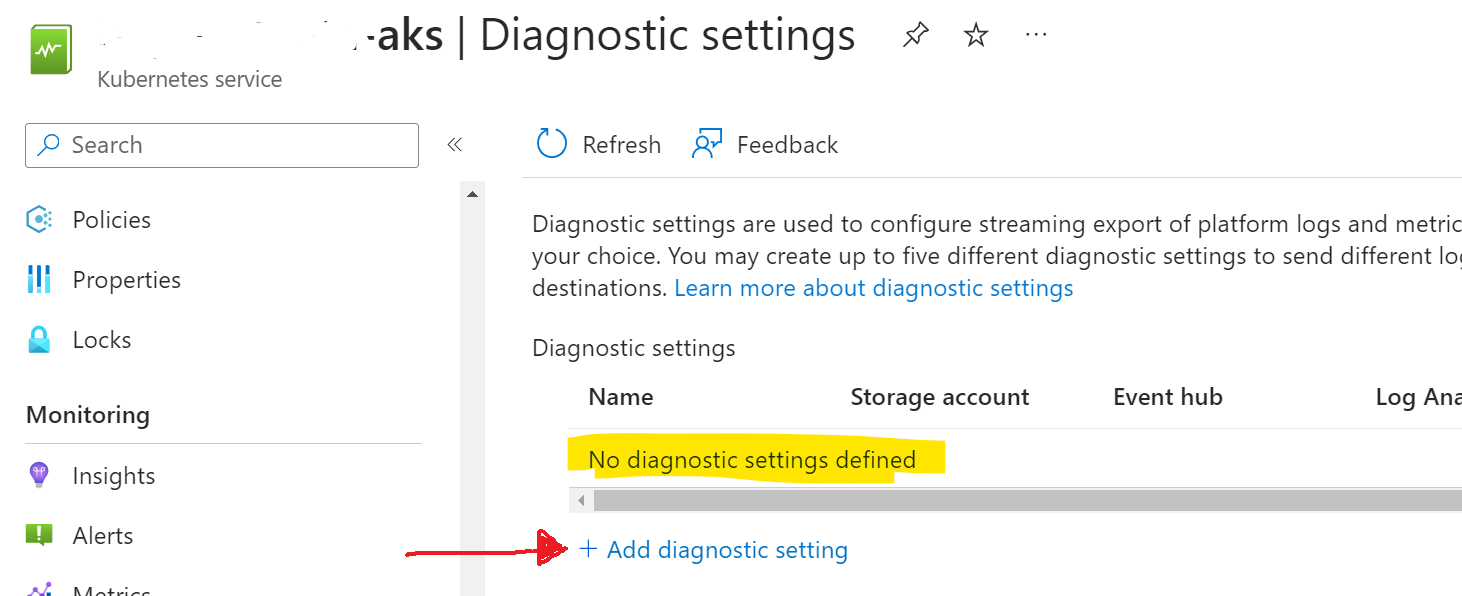
After clicking I was presented with a page containing all the diagnostic settings for the particular resource, in this case Diagnostic settings for AKS. This settings page adjusts according to the resource that is going being configured.
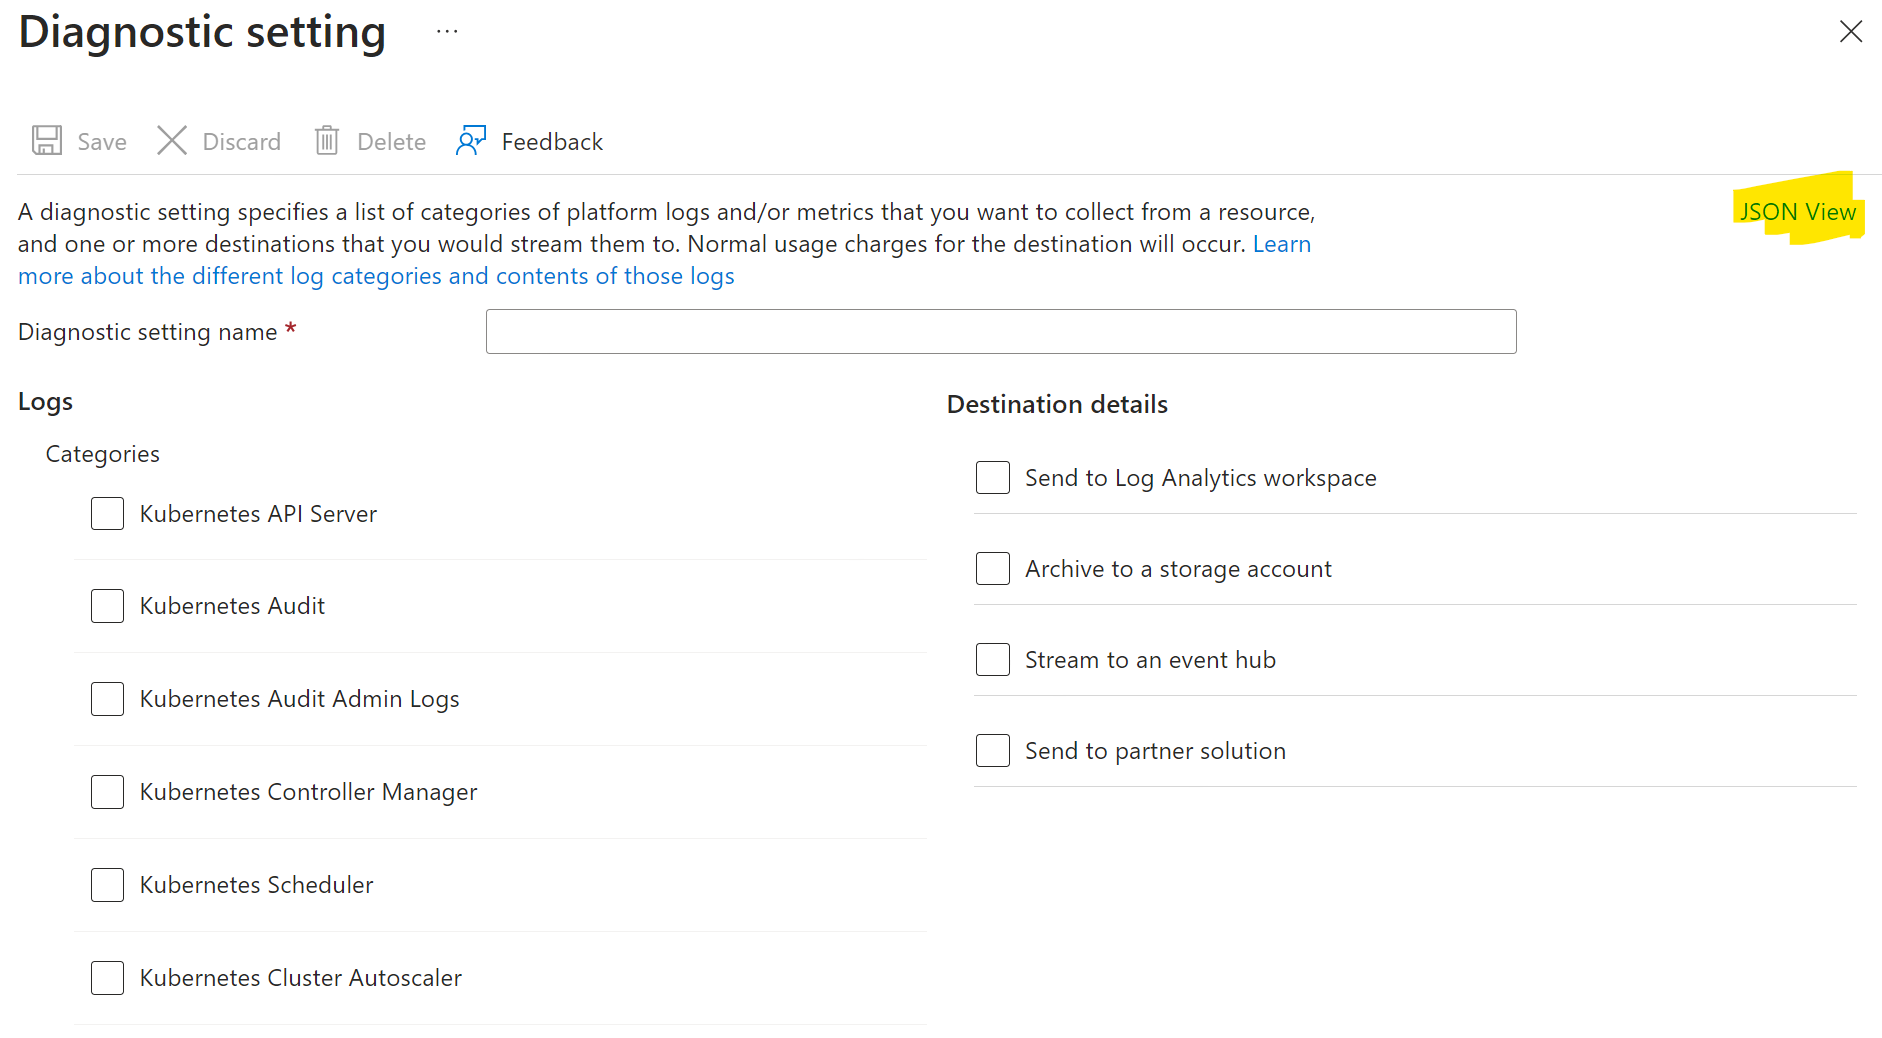
The screen shows the friendly names of the log categories, while we need the technical names. By clicking the “Json view” on the top right, a pane appears in which the ARM json definition is shown, containing the properties and technical names for the log categories.
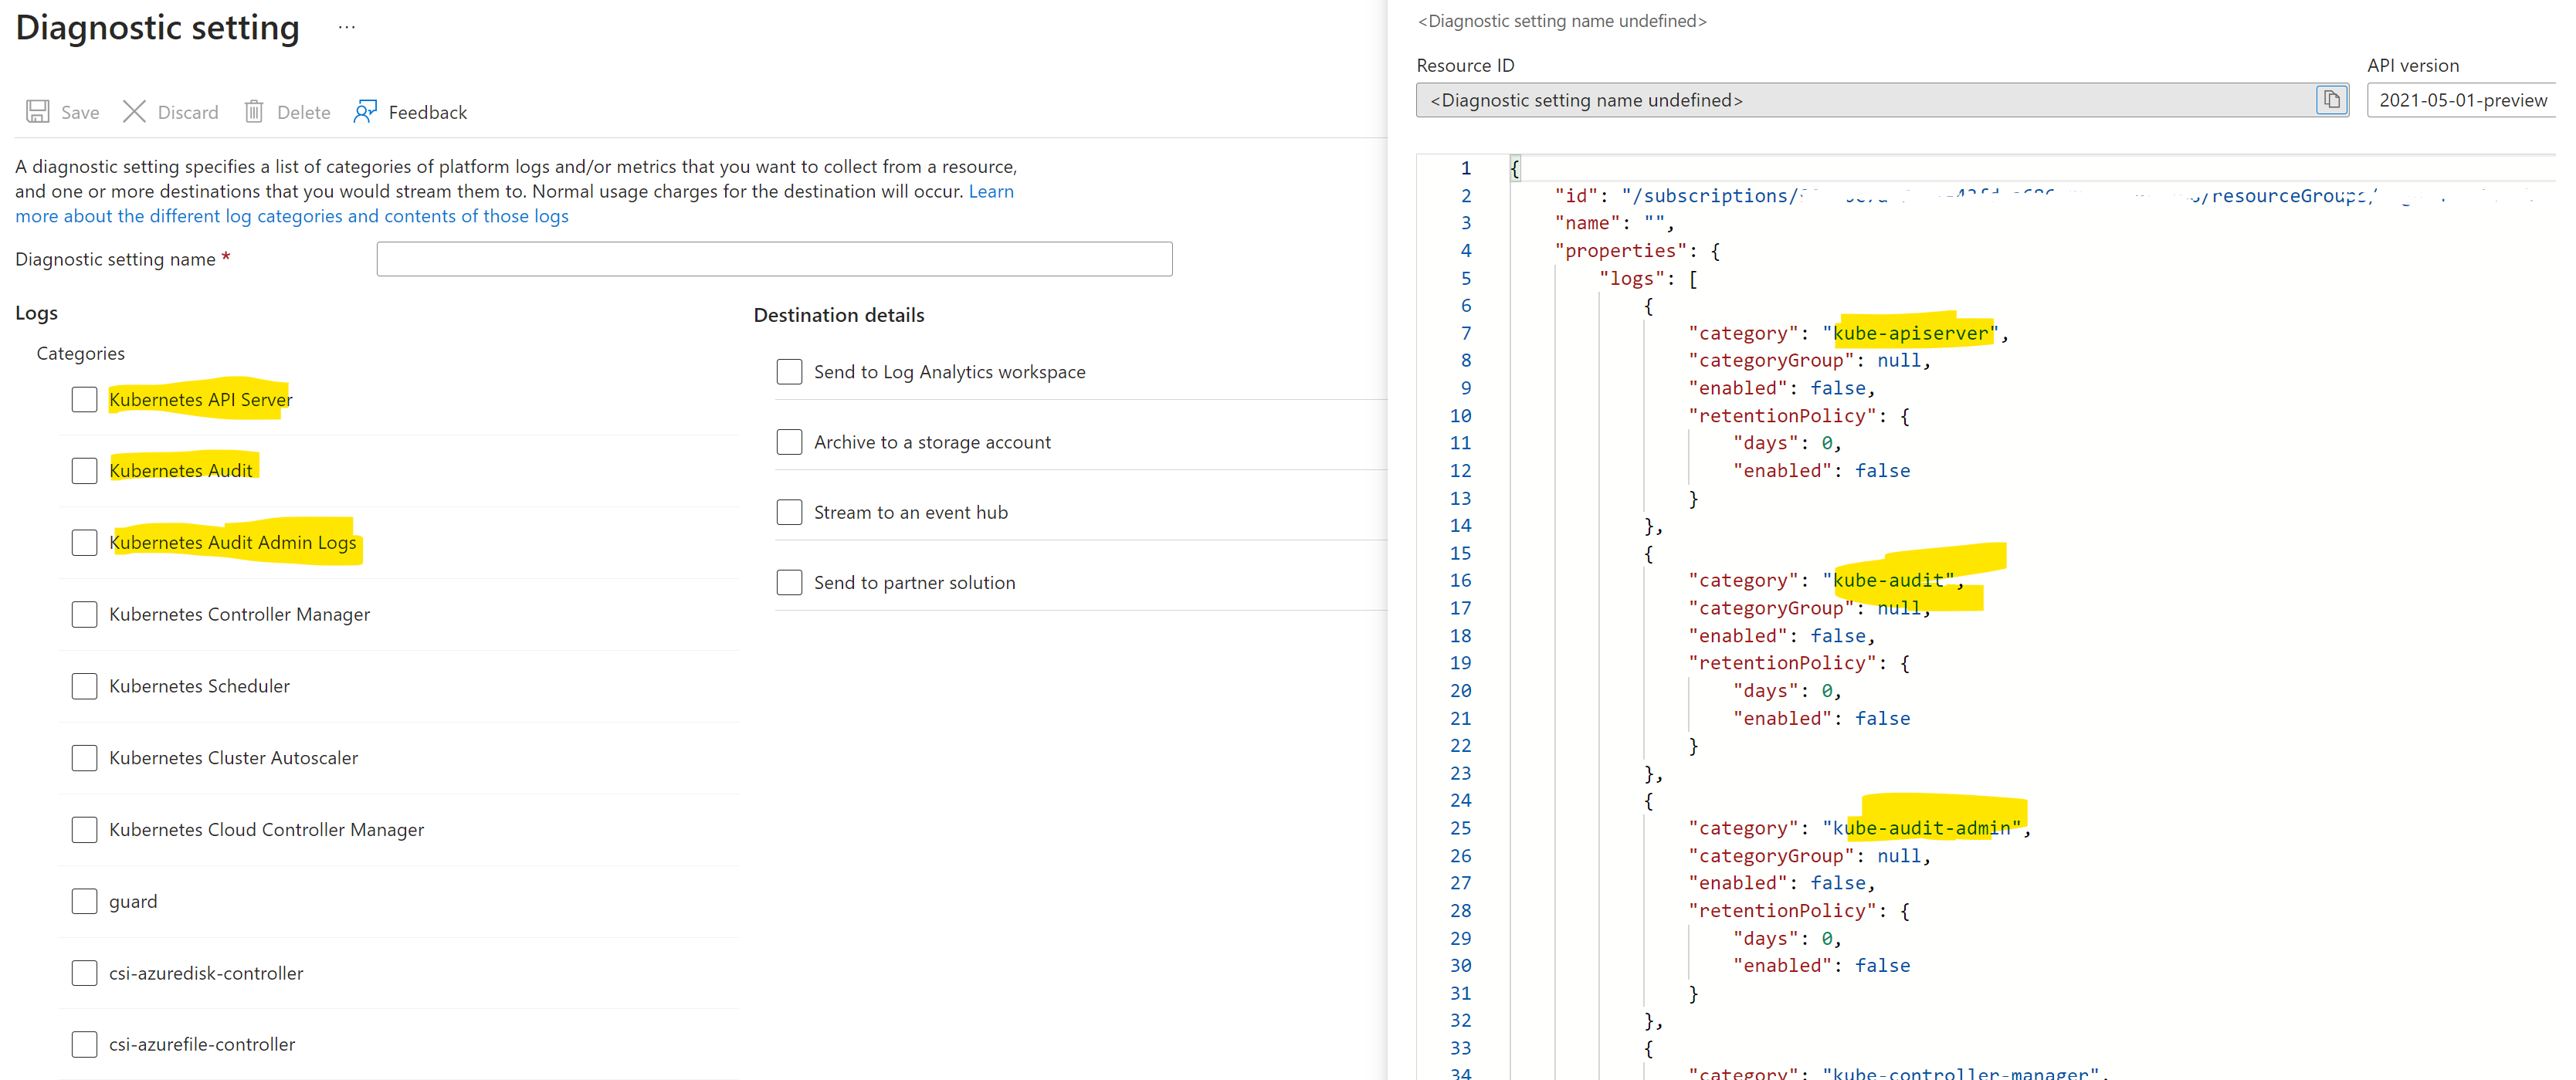
I copied the information and closed the screen. Using this information, it turned out to be simple to setup Diagnostic logging in Bicep. First I could lookup what resource I needed - Microsoft.Insights/diagnosticSettings - to get the proper syntax. Using that I could use the technical names of the categories that I needed in my Log Analytics Workspace. In the Bicep for the diagnosticSettings I needed to set the scope to the previous created AKS cluster by using its symbolic name.
@description('Log Analytics workspace name')
param existingWorkspaceName string
param existingSubscriptionId string
param existingResourceGroupName string

var workspaceResourceId = resourceId(existingSubscriptionId, existingResourceGroupName, 'Microsoft.OperationalInsights/workspaces', existingWorkspaceName)

resource cluster 'Microsoft.ContainerService/managedClusters@2022-11-01' = {
  location: location
  name: clusterName
  ...
}

resource diagnostics 'Microsoft.Insights/diagnosticSettings@2021-05-01-preview' = {
  name: '${cluster.name}-diag'
  scope: cluster
  properties: {
    workspaceId: workspaceResourceId
    logs: [
      {
        category: 'kube-apiserver'
        enabled: false
      }
      {
        category: 'kube-audit'
        enabled: true
      }
      {
        category: 'kube-audit-admin'
        enabled: true
      }
      {
        category: 'kube-controller-manager'
        enabled: false
      }
      {
        category: 'kube-scheduler'
        enabled: false
      }
      {
        category: 'cluster-autoscaler'
        enabled: false
      }
      {
        category: 'cloud-controller-manager'
        enabled: false
      }
      {
        category: 'guard'
        enabled: true
      }
      {
        category: 'csi-azuredisk-controller'
        enabled: false
      }
      {
        category: 'csi-azurefile-controller'
        enabled: false
      }
      {
        category: 'csi-snapshot-controller'
        enabled: false
      }
    ]
    metrics: [
      {
        category: 'AllMetrics'
        enabled: true
      }
    ]
  }
}
The result
After running the Bicep in my workflow, I reopened the Azure Portal and went to the Diagnostic settings. It was configured the way I wanted it to be.
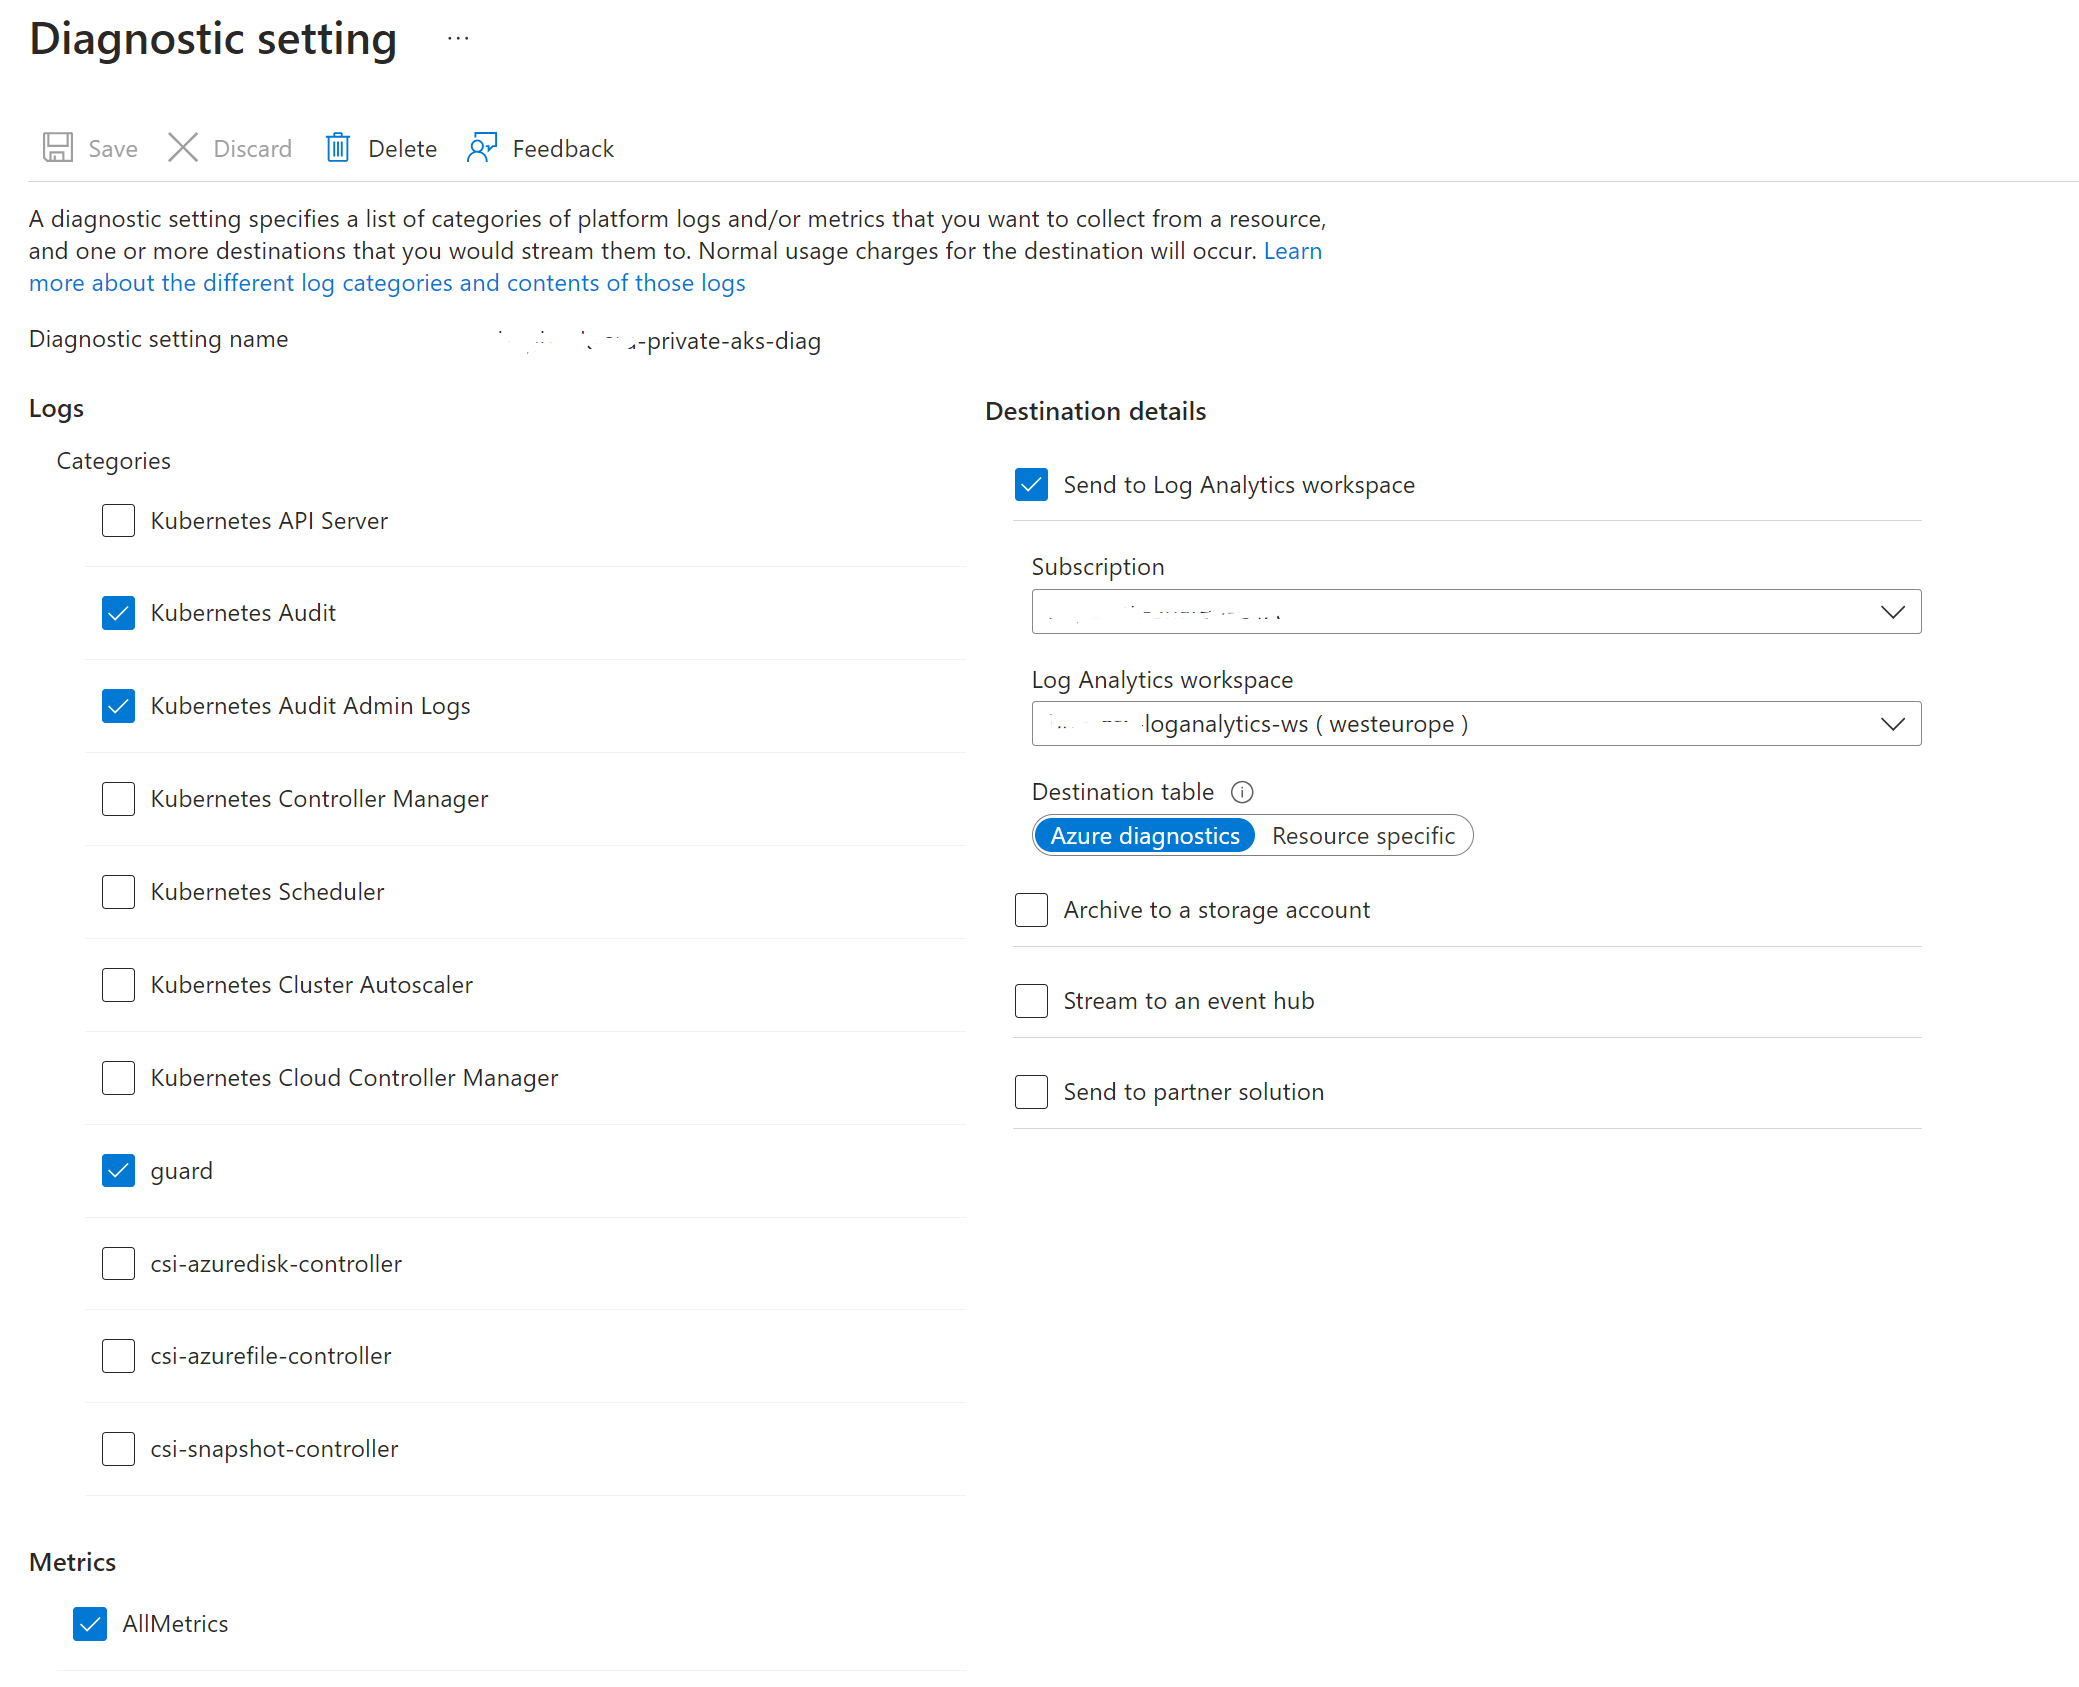
Setting up diagnostic settings was not that hard, finding out what I needed to configure was more cumberstone. It would be of so much more help if Microsoft had set ip its documentation in a way that you could find all related information in the same section. Thus referencing to related objects, describing technical names etc… The pattern is the same all kinds of resources: Setup the diagnostic settings with specific values then scope it to the correct resource.
It would save a lot of time for many developers.

