

The Art of Conversation
In the 1990’s when I did my bachelor in computer science, teachers told us that we would be replaced by 4GL languages. Languages in which end-users would describe how applications should work. At that time we laughed at them, saying we saw the exact opposite. Oh dear, we were right. Code became complexer, new concepts arrived on the horizon and software development matured. Fast forward to the 2020’s…
Over the last year, I’ve been giving a lot of GitHub Copilot training sessions world wide. Sessions in which I learned the attendees what GitHub Copilot could mean for them and how they could get the most out of it. In that time I noticed that I was particular a fan of GitHub Copilot chat. A Chat interface in which I could talk to my bestie, asking him all kinds of questions. My bestie would answer my questions as good as possible.
I’m an avid runner, and in order to do my trainings in the cold dark winter months as well I purchased a treadmill. This treadmill came with a companion app - that eventually required a subscription to get the most out of it. As a user I was frustrated and upset, I decided to build my own companion app. A real challenge.
Where to start?
Finding out what protocol was being used, write library to control the device, dive into mobile app development as I want the companion to run on my Android tablet, work with GPX data to run previous ran tracks, visualizing data, etc. This lead me into a modus in which I started to find coding solutions for all these problems and one of those problems was visualization.
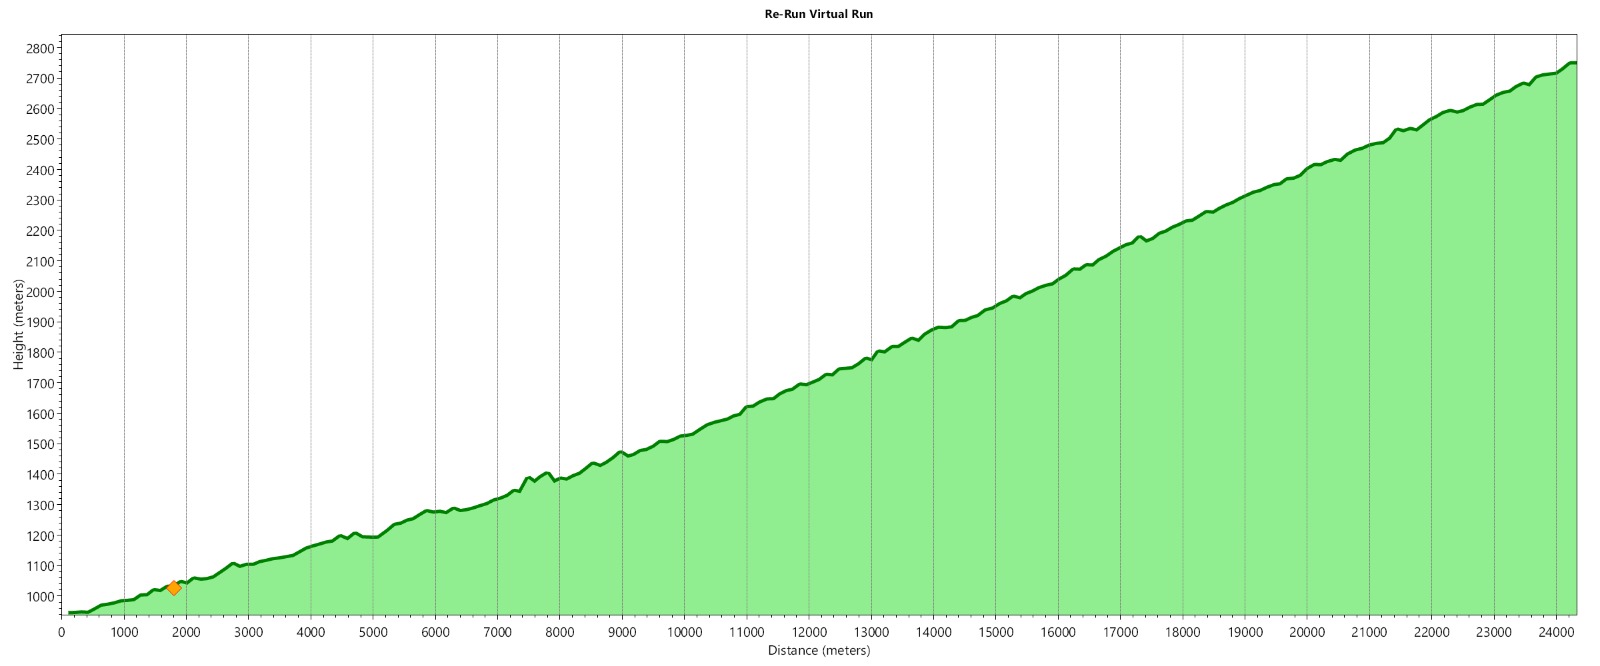
In my head I envisioned imagery in which I see over the course of the track all hills that I need to ascend or descend. Showing the actual GPS height in relation to the actual distance.
In order to create this image, I opened GitHub Copilot and started my first prompts. While doing that I got annoyed by the cramped real estate on my desktop. I switched over to Microsoft Copilot in the browser.

Building the visual using just conversation
I remembered the teachers’ talk about 4GL’s, and I decided if I as an end user was capable of writing code by just telling what I my intend was. So it began. It took me 9 prompts to come the visual chart above. One prompt for setting the context, Eight prompts to do all the mark up. I’ll show you how:
Context first
I entered a very explicit context telling what I wanted to achieve and indicating what was important for me. A clear context makes or breaks the conversation. Copilot knew at that point what I wanted to achieve and that platform independency and C# are prerequisites.
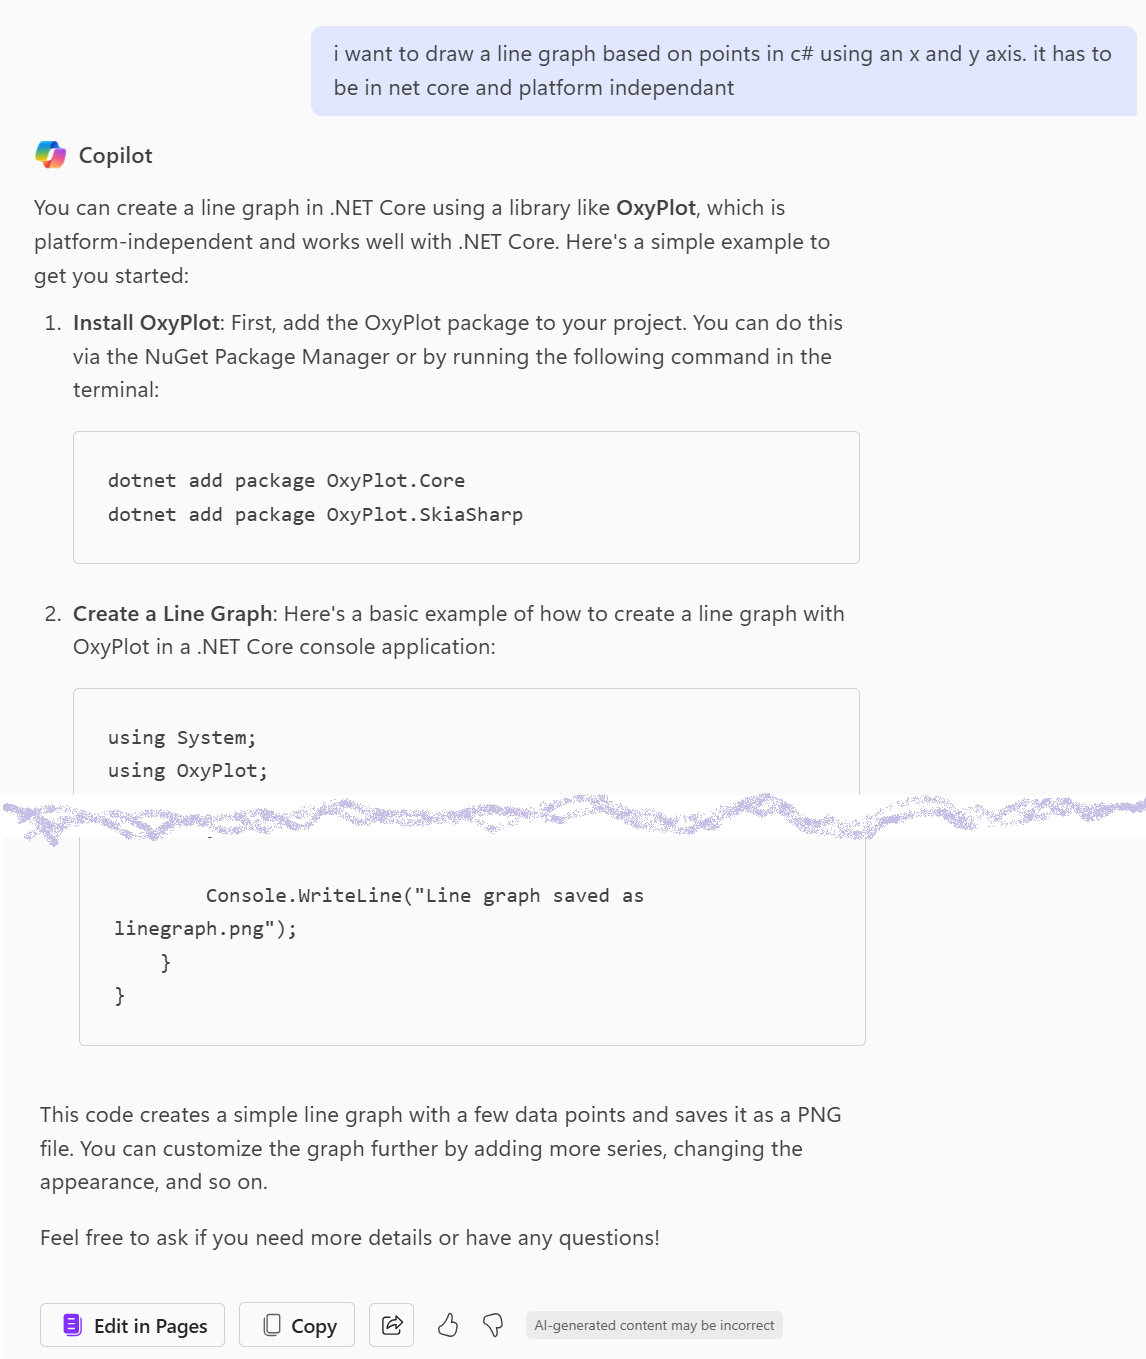
Keep refining
I pasted the code suggestion in Visual Studio, added the library packages and compiled the code. A graph was rendered and stored to a file. Boom!
Needless to say that I needed to add some more refinement. So I fired the next prompts to get me to the result that I needed. During the refining I switched to my native language (which is Dutch) and Copilot followed me along not hindered by any switching. For me this was a big convenience, because things get less complicated when thinking natively :)
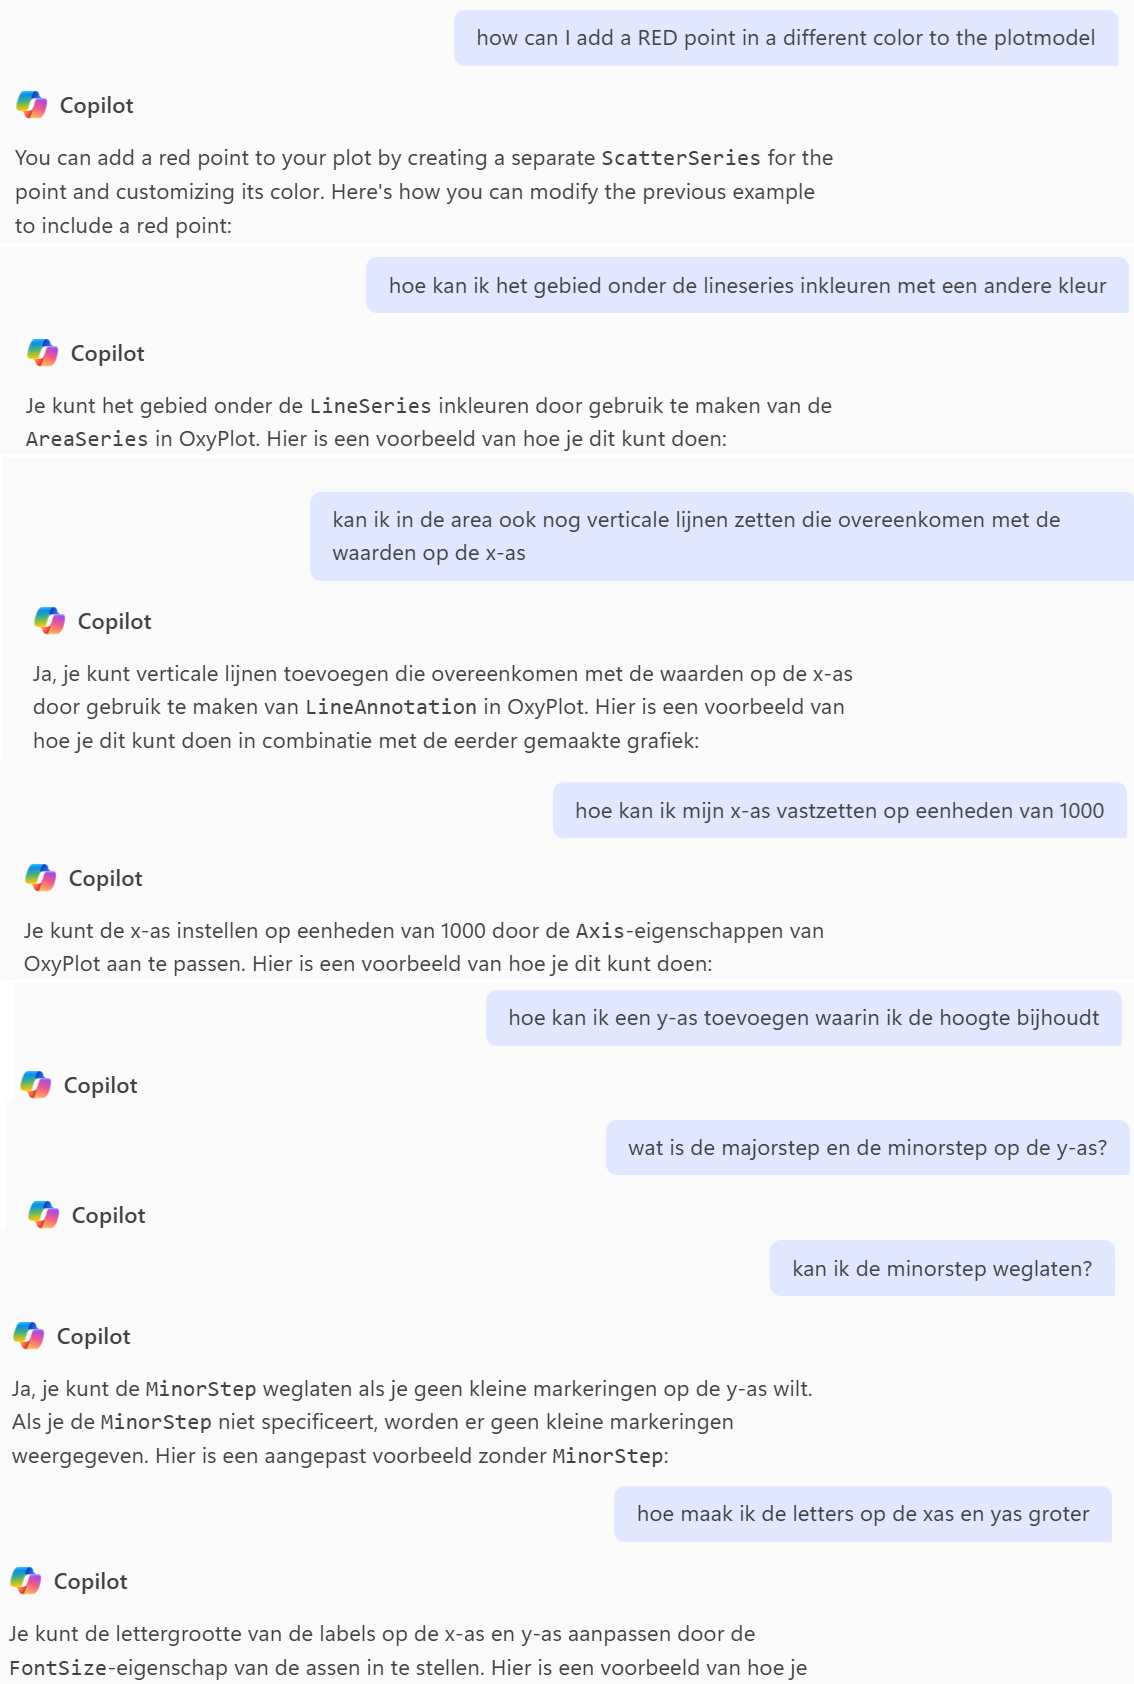
The result
Just by having a conversation, I managed to build the basic functionality that I envisioned.
using OxyPlot;
using OxyPlot.Axes;
using OxyPlot.Series;
using OxyPlot.SkiaSharp;

class Program
{
    static void Main(string[] args)
    {
        var plotModel = new PlotModel { Title = "Line Graph with Larger Axis Labels" };

        var lineSeries = new LineSeries
        {
            Title = "Line Series",
            MarkerType = MarkerType.Circle
        };

        // Add points to the line series
        lineSeries.Points.Add(new DataPoint(0, 0));
        lineSeries.Points.Add(new DataPoint(1000, 2));
        lineSeries.Points.Add(new DataPoint(2000, 4));
        lineSeries.Points.Add(new DataPoint(3000, 8));
        lineSeries.Points.Add(new DataPoint(4000, 16));

        plotModel.Series.Add(lineSeries);

        // Create an area series to fill the area under the line series
        var areaSeries = new AreaSeries
        {
            Color = OxyColors.LightBlue,
            Fill = OxyColors.LightBlue,
            StrokeThickness = 0
        };

        // Add points to the area series
        areaSeries.Points.Add(new DataPoint(0, 0));
        areaSeries.Points.Add(new DataPoint(1000, 2));
        areaSeries.Points.Add(new DataPoint(2000, 4));
        areaSeries.Points.Add(new DataPoint(3000, 8));
        areaSeries.Points.Add(new DataPoint(4000, 16));

        // Add the baseline points to close the area
        areaSeries.Points2.Add(new DataPoint(0, 0));
        areaSeries.Points2.Add(new DataPoint(1000, 0));
        areaSeries.Points2.Add(new DataPoint(2000, 0));
        areaSeries.Points2.Add(new DataPoint(3000, 0));
        areaSeries.Points2.Add(new DataPoint(4000, 0));

        plotModel.Series.Add(areaSeries);

        // Add vertical lines at each x-axis value
        for (int i = 0; i <= 4000; i += 1000)
        {
            var verticalLine = new LineAnnotation
            {
                Type = LineAnnotationType.Vertical,
                X = i,
                Color = OxyColors.Gray,
                LineStyle = LineStyle.Dash
            };
            plotModel.Annotations.Add(verticalLine);
        }

        // Set the x-axis to units of 1000 with larger font size
        plotModel.Axes.Add(new LinearAxis
        {
            Position = AxisPosition.Bottom,
            Minimum = 0,
            Maximum = 4000,
            MajorStep = 1000,
            Title = "X-Axis (units of 1000)",
            FontSize = 16 // Set font size for x-axis labels
        });

        // Add the y-axis to track height with larger font size
        plotModel.Axes.Add(new LinearAxis
        {
            Position = AxisPosition.Left,
            Minimum = 0,
            Maximum = 20,
            MajorStep = 2,
            Title = "Height",
            FontSize = 16 // Set font size for y-axis labels
        });

        // Create a scatter series for the red point
        var scatterSeries = new ScatterSeries
        {
            MarkerType = MarkerType.Circle,
            MarkerFill = OxyColors.Red,
            MarkerSize = 5
        };

        // Add the red point
        scatterSeries.Points.Add(new ScatterPoint(2, 4));

        plotModel.Series.Add(scatterSeries);


        // Export the plot to a PNG file
        using (var stream = new System.IO.FileStream("linegraph_with_larger_axis_labels.png", System.IO.FileMode.Create))
        {
            var exporter = new PngExporter { Width = 600, Height = 400 };
            exporter.Export(plotModel, stream);
        }

        Console.WriteLine("Line graph with larger axis labels saved as linegraph_with_larger_axis_labels.png");
    }
}
All for me left to do, was to pick up this code and refactor it manually to a class to work with my actual GPX data (see code sample below).
It turned out in the end, that the teachers back then used to have a valid point. One day we might lose our job, but not because of 4GL. For the foreseabale future I see that Artificial Intelligence will change the way we write code, by focussing on adding functionality rather than focussing on technicalities. Functionality that we can achieve by having a conversation, in which you have to be concise. A direction in software development that I embrace.
using OxyPlot;
using OxyPlot.Annotations;
using OxyPlot.Axes;
using OxyPlot.Series;
using OxyPlot.SkiaSharp;

namespace Re_RunGPX
{
    internal class GraphPlotter
    {
        public void PlotGraph(GpxProcessor gpx, string outputFile)
        {
            double maxDistance = (double)(gpx.Tracks.Last().TotalDistanceInMeters / 1000) * 1000;
            if (maxDistance<1000) maxDistance = 1000;

            double minElevation = gpx.FindMinimumElevation();
            double maxElevation = gpx.FindMaximumElevation();
            int elevationScale = maxElevation > 100? 100 : 10;

            var plotModel = new PlotModel { Title = "Re-Run Virtual Run" };
            plotModel.Background = OxyColors.White;

            Random random = new Random();
            int randomIndex = random.Next(0, gpx.Tracks.Length - 1);

            plotModel.Axes.Add(new LinearAxis
            {
                Position = AxisPosition.Bottom,
                Minimum = 0,
                Maximum = maxDistance,
                MajorStep = 1000,
                Title = "Distance (meters)",
                FontSize = 20
            });

            plotModel.Axes.Add(new LinearAxis
            {
                Position = AxisPosition.Left,
                Minimum = (double)((minElevation/10) * 10),
                Maximum = (double)(maxElevation + elevationScale),
                MajorStep = elevationScale,
                Title = "Height (meters)",
                FontSize = 20
            });

            var areaSeries = new AreaSeries
            {
                Title = "Elevation",
                Color = OxyColors.Green,
                Fill = OxyColors.LightGreen,
                StrokeThickness = 10
            };

            foreach (var track in gpx.Tracks)
            {
                areaSeries.Points.Add(new DataPoint((double)track.TotalDistanceInMeters, (double)track.EndElevation));
            }
            plotModel.Series.Add(areaSeries);

            for (int i = 1000; i <= (int)maxDistance; i+=1000)
            {
                var verticalLine = new LineAnnotation
                {
                    Type = LineAnnotationType.Vertical,
                    X = i,
                    Color = OxyColors.Gray,
                    LineStyle = LineStyle.Dash
                };
                plotModel.Annotations.Add(verticalLine);
            }

            // Create a scatter series for the red point
            var scatterSeries = new ScatterSeries
            {
                MarkerType = MarkerType.Diamond,
                MarkerStroke = OxyColors.Red,
                MarkerFill = OxyColors.Orange,
                MarkerSize = 10
            };

            // Add the red point
            // TODO: make this a real point not a random one
            scatterSeries.Points.Add(new ScatterPoint((double)gpx.Tracks[randomIndex].TotalDistanceInMeters,
                                                      (double)gpx.Tracks[randomIndex].EndElevation));
            plotModel.Series.Add(scatterSeries);

            using (var stream = new System.IO.FileStream(outputFile, System.IO.FileMode.Create))
            {
                var pngExporter = new PngExporter { Width = 2400, Height = 1000 };
                pngExporter.Export(plotModel, stream);
            }
        }
    }
}