
Entity Relationship Diagram Creator
Introduction
A couple of years ago I developed the Entity Relationship Diagram Creator XRMToolbox plug-in, as a community tool. Shortly after, my focus was more-and-more on the Azure space and the JourneyIntoCRM.com blog vanished into oblivion. Fast forward to may 2023… I was preparing for the Microsoft Certified: Power Platform Solution Architect Expert certification.
While preparing I noticed that Microsoft recommended this plug-in to visualize datamodels in the Dataverse. For me a nice opportunity to overhaul the toolbox plug-in and to bring it back to life again. First step… reinstate the user manual and update the plug-in to reference to the new documentation location.
How to use…
In the XRMToolbox, look for the Entity Relationship Diagram Creator plug-in.
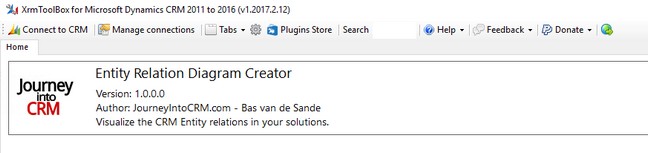
When you launch it for the first time, the Help page is shown (this can be turned off).
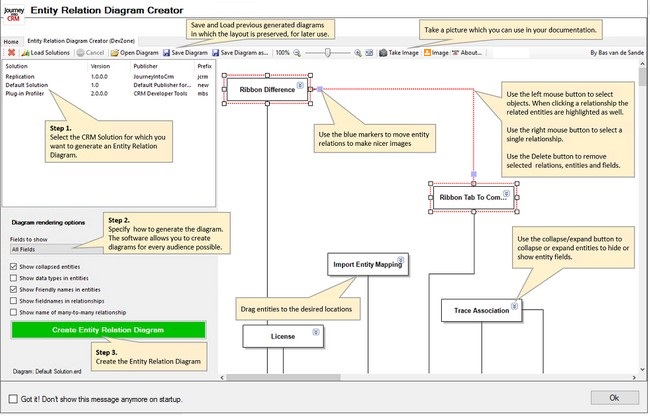
After you launch the plug-in, you have to load the solutions that are present in your CRM environment. Once a solution is selected you can specify how you want to render the Entity Relation Diagram. This depends on the audience you are targetting.
Render options
In the “Fields to show”, you specify what fields of the entities in the solution you want to show. When you choose to show “Custom fields from publisher”, only the fields of the publisher (prefix) will be shown.
When you choose to show “Custom fields from all publishers”, then you will see all custom fields present in the entities.
When you choose to show “All Fields”, all fields (including the system fields) will be shown. That list can be really long.
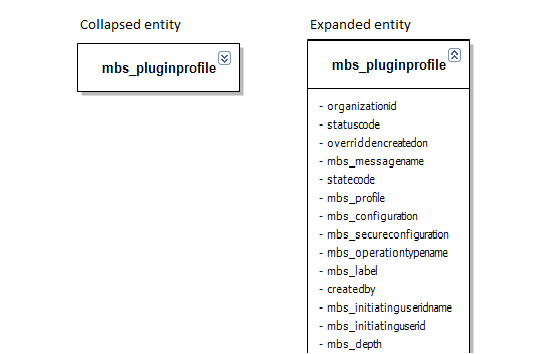
Furthermore you can specify if you want the entities to appear as collapsed or expanded entities. In the rendered diagram you can choose to expand or collapse entities.
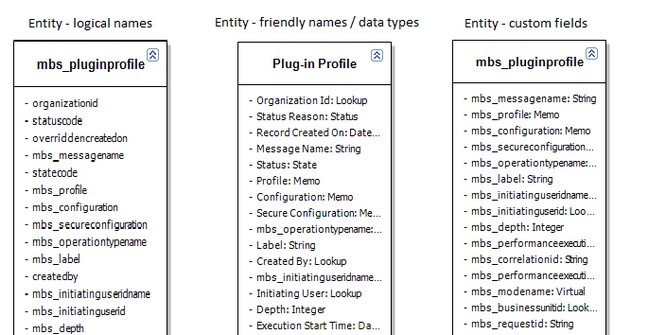
Dependent on the target audience you can choose to show or hide field data types and choose if you want to use display names (friendly names) for both entities and fields.
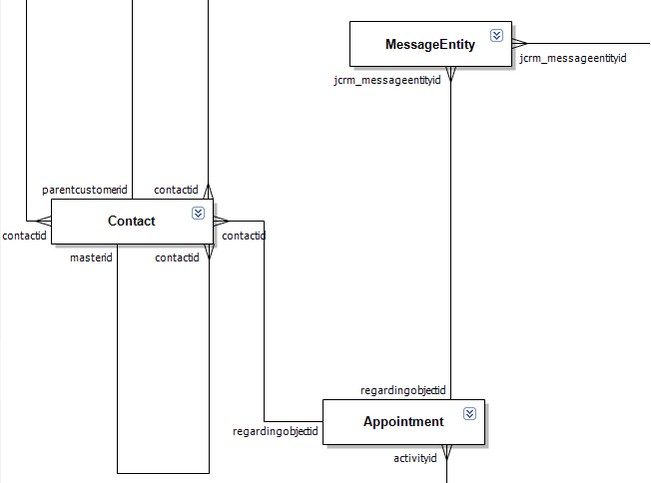
Regarding to relationships you can specify if you want to see the fields on which the relationships are based and in the case of many-to-many relationships the name of the relationship.
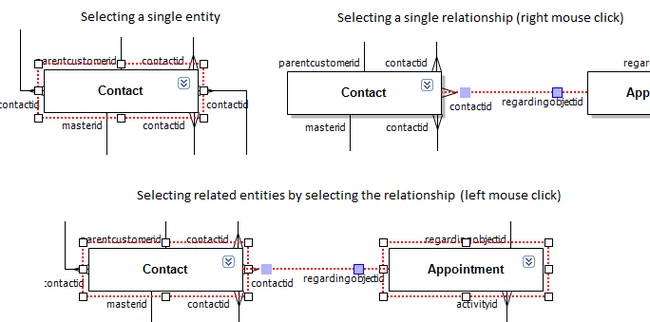
Once the options are set you can click the green button to render the diagram. At this moment I render the entities in a grid. The fun part for you is to rearrange the way I rendered the entities. You can do this by selecting an entity(the entity will be highlighted), or by selecting a relationship.
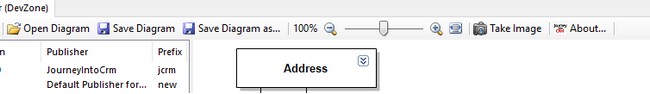
Once the entities are located correctly, you can either choose to save the diagram or you can take an image of the diagram. Diagrams that are saved, can be used afterwards (by opening, altering and saving under a different name).
Rendering images
When you take an image of the diagram, the crossing relationships lines are altered automatically to show a bump in the horizontal line at the location where a vertical line crosses a horizontal one.
Future ideas
Right now I’m thinking of ways to improve the plug-in. I already have some ideas on improving the algorythm I use to render the diagram. Right now I render the entities on a first come first serve basis.
In a next version I’ll activly looking for hotspots in the entity schema and organize the entities around the hotspots. Besided that I want to improve the position of the relationship identifiers.
Furthermore I want to add some additional options, e.g. the option to show hidden solutions as well. As well as the option to draw relationships with entities that are not within the solution. That way dependencies between solutions become more clear.
For now I hope you’ll enjoy this plug-in. Please feel free to send me comments, remarks, compliments and/or suggestions. I need your feedback to improve the functionality.
Enjoy!